ABSTRACT
A typical measuring analyzers produced by the KAMIKA Instruments company it is possible to divide in respect of the way of determining the shape of particles.
Shape of the particle is sometimes the most important parameter which seek technologists. Determining the shape in a plane with the microscopic technique is not precise enough. The drawing conclusions from such measurements can be burdened with mistakes. Only technique of digital optical converters, implemented by the KAMIKA Instruments company, enabled the precise evaluation of the shape of single particles comprising on freely large set of measured particles.
Opto-electronic measurement devices that are currently produced can be adjusted to continuous measurements with use of „by pass” in fast and cheap way. To transform laboratory measurement technique into industrial „on-line” measurement technique, analyzers should be placed in the direct proximity of mills, crushers and conveyor machines.
DOWNLOAD ARTICLE

AUTHORS
Stanisław Kamiński, Dorota Kamińska - KAMIKA Instruments, info@kamika.pl
FIELD
ANALYZERS
KEYWORDS
SOURCE
Powder&Bulk, SPECIAL for POWTECH 2014
ARTICLE
One-dimensional measurement
Typical one-dimensional measurement contains information about a maximum particle size according to the way as shown in Fig. 1. [1]

Fig. 1. The measurement in the parallel beam
The method consists in it that shape of the particle is mapped with electrical impulse. Amplitude of impulse corresponds to the maximum size of the particle. This is carried out with the help of digital technology using A/C converter for frequency of 500 kHz and a resolution of 12 bits. By scanning the grain a dozen times it is possible to get the second size. At such a frequency of the converter it is possible to determine the amplitude of impulse with an accuracy of 1% but because of speed of the move of particle through the measuring space for thickness of about one hundred microns the measurement error of impulse width is approximately 20% . At such a mistake one should not take into account of measurements of the second size.
For determining the particles size distribution such as for mechanical sieves one size will suffice in the form of the amplitude. Then manner of the calibration of the analyser according to the measurement compatible with sieves is shown in Fig.2.

Fig. 2. The sieve calibration of optical-electronic instrument.
Two-dimensional measurement
In order to get the two-dimensional shape of the particle on two perpendicular planes according to the way shown on Fig. 3. one should increase the frequency of measurements of converter until 12 MHz or more.
 |
A. Optical - electronic measurement
|
Fig 3. The two-dimensional shape measurement of the particle on two perpendicular planes
Increasing the frequency of the scanning of impulse twenty-four times allows on multiple increasing the measurement accuracy of impulse widths, ie. of the second size of particle. Then the amount of scans of the single grain increases to a few hundred.
One should pay attention that measuring accuracy of the second size also depends on the inertia of the particle, ie. on specific gravity of material from which the particle is built. For the scatter of measurements results of the second size there is also an impact the way of forming the air flow in which the particle moves. In general it can be assumed that the measurement accuracy of the second size is approximately 5%.
By obtaining two-dimensional particle it is possible to determine the shape coefficients - Wk
Wk= amplitude of impulse / impulse width = d/s
At determining the width of the particle one should take into account the width of the measuring space as it is shown on Fig. 4.
 |
Sz - measured width of particle S - calculated width of particle |
Fig. 4. Correlation between the width of the particle and the width of the measuring space.
From the data obtained regarding the two sizes for each particle it is possible to get the graphical information in the form of the set of graphs shown on Fig. 5

Fig. 5. Sample results of the measurements obtained from the 2DiSA analyzer
Three-dimensional measurement
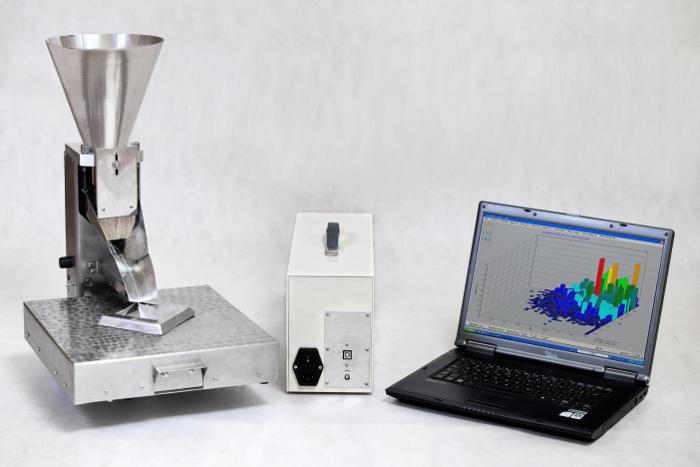
Widening the two-dimensional measurement adding an extra dimension from perpendicular direction to previous dimensions is obtained the three-dimensional measurement of particle. The design of the instrument shown on Fig. 6 ensures simultaneous measurement of sizes of particles from two perpendicular directions and due to the amount of scans the particle is determined a third size.

Fig. 6. Construction of the optical parts of AWK 3D
The results obtained in the form of three distributions of particle size distribution it is possible to systematize with Zingg method according to the proportion for sizes: of smallest to medial and of medial to maximum. When all sizes are equal to each other then the particle has a spherical shape. If the sizes are different then particles shape will be cylindrical or disk and can show the flat pyramids called blades as shown on Fig. 7.

Fig. 7. Scheme of Zingg classification
Result of the measurement shown on Fig. 8 allows to determine the quantitative and weight percentage of individual shapes in the set of particles.

Fig. 8. Sample results of the 3D measurements obtained from the AWK 3D analyzer
Summary
Depending on needs it is possible to apply the various measurement methods.
One-dimensional measurement can be used for the evaluation of particle size distribution and for sieve measurements.
Two-dimensional measurement apart from sieve analysis allows the assessment of particles sphericity by the coefficient Wk. This is a very important parameter for many materials, eg. for abrasive materials.
Three-dimensional measurement also contains the sieve analysis and enables the accurate analysis of shape of grains. According to such a measurement it is possible exactly to determine what percentage amount of grains has undesirable shapes, for example as a result of breaking the correct grains or due to abnormal process of formation of the granules. This is especially useful for the production of fertilizers. In the "on-line" mode enables it fast and direct interference during the production what allows easily to fulfil the specifications concerning the receipt of fertilizers or any granules.
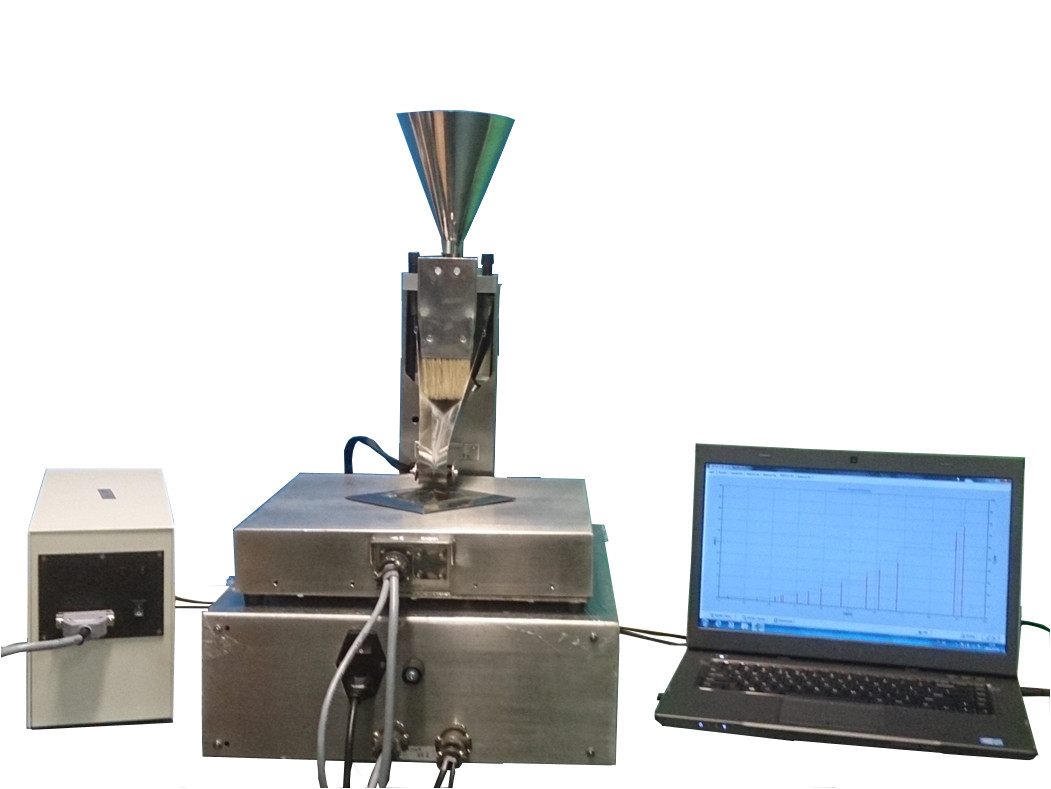
KAMIKA Instruments in very close cooperation with R&D Department one of Polish fertilizers plant has implemented such a system. The main goal of the project was to measure size and shape of the granules of superphosphate in real time on production line. The project started with purchase of AWK 3D laboratory analyzer in order to test the production process. Good knowledge of distribution of granulation on different points of production line allowed to choose the best place of on-line sampling to get the representative probe of the final product. The on-line measurements started 6 months from purchase of laboratory equipment and full implementation was completed within 1 year from beginning of project. The AWK 3D analyzer during on-line measurements is shown on Fig.9.

Fig. 9. AWK 3D analyzer measures size and shape of the granules of superphosphate in real time on production line
Measurement of superphosphate:
- Extremely difficult conditions on the production line
- Line capacity: 500 tonnes / day
- The sample collected automatically
- After finishing the measurement there is a signal to take the next sample
- Measurement in every 15 minutes – 96 measurements a day
- Real-time results
- Accuracy better than 4 %
- Alarms available for line operator when granulation does not match the set standard.
Database with detailed results of the measurements is available to the production manager, engineers, R&D department and helps to develop the final product and enable the selection of appropriate proportions of blends. And what is most important the real-time measurements of granulation of fertilizers allow to instantly detect and respond immediately to problems in the production process, what results in significant savings.
[1] Detailed descriptions of graphs are shown on the website: www.kamika.pl
| Analyzer AWK 3D | Analyzer P_AWK 3D |
 |
 |
measuring range
KAMIKA Instruments
Unlimited


Language:
Infoline: +48 22 666 93 32
KAMIKA Instruments
EU projects
Our instruments presented accoriding to measurement type and range.
Social media
What do you want to measure ?
Quality confirmed by ISO 9001 cert.
Analyzers
Instrument in design: Mini 3D
AWK 3D
2DiSA
IPS K
IPS UA
Averager
IPS T
AWK D
AWK B
IPS SAM
IPS L
IPS LCW
IPS U
IPS A
Copyright © KAMIKA Instruments 2014 | created with WebWave CMS